Volatility Metrics in Digital Slots: Examining Influences on Extended Play Sessions

Volatility metrics serve as core analytical tools in digital slot offerings, where they quantify the frequency and magnitude of payout variations across different games. Researchers track these measures through standard deviation calculations and hit frequency rates, which together reveal how prize distributions unfold over thousands of spins. Data from industry reports shows that low-volatility slots tend to deliver smaller wins at regular intervals, while high-volatility variants produce larger but less frequent payouts that stretch across longer sequences.
Core Components of Volatility Measurement
Standard deviation stands as the primary statistical foundation for assessing slot volatility, because it captures the spread of returns around the expected value in any given title. Hit frequency complements this by recording how often winning combinations appear, a figure that directly shapes session length when players continue spinning. Return to player percentages interact with these metrics, yet volatility remains distinct since it focuses on payout rhythm rather than overall payback rate. Analysts at research institutions compile these numbers from extensive simulation runs that model millions of outcomes under controlled conditions.
Classification Systems Used by Operators
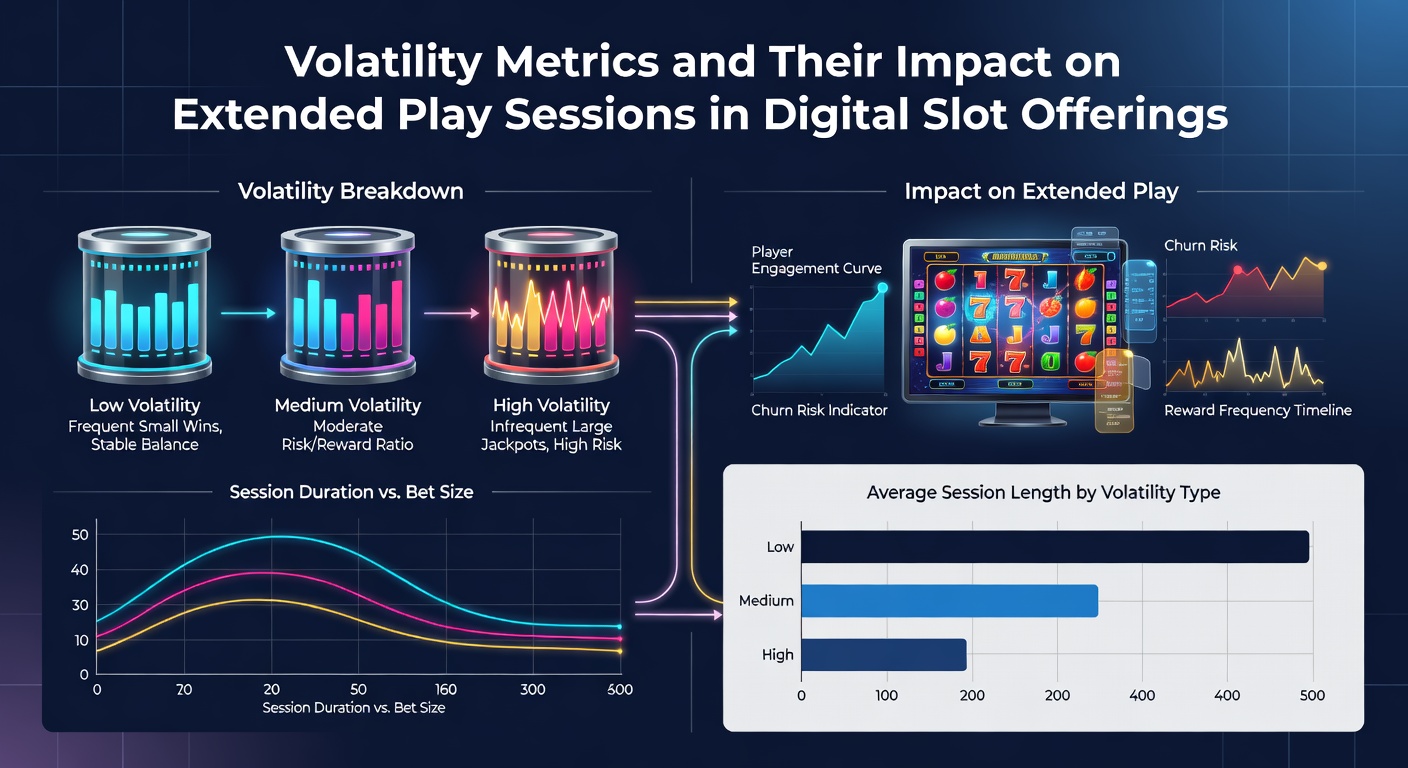
Operators categorize slots into low, medium, and high volatility tiers based on aggregated performance data collected from live play logs. Low-volatility games typically register hit frequencies above 30 percent with modest prize multipliers, which supports steady bankroll movement during extended sessions. Medium-volatility titles occupy the middle range with hit rates between 15 and 30 percent, creating balanced patterns that many players encounter in mixed sessions. High-volatility slots often show hit frequencies below 15 percent alongside multipliers that exceed 100 times the stake, producing the pronounced swings documented in operator databases.
According to findings released by the American Gaming Association, volatility classifications help developers align game design with specific player retention goals across different markets. These classifications draw from real-time telemetry that tracks session duration alongside payout events, allowing precise adjustments during game updates.
Observed Effects on Prolonged Gaming Periods
Extended play sessions in digital slots respond directly to volatility levels because payout timing influences how long participants remain engaged before adjusting their stakes or switching titles. Sessions on low-volatility games frequently last longer in aggregate minutes, since consistent small returns reduce the pressure to stop after short sequences. High-volatility offerings instead correlate with shorter average session lengths in some datasets, although individual players may extend play when chasing infrequent large outcomes. Figures from European gaming trade groups indicate that volatility interacts with session length metrics collected across thousands of accounts in multiple jurisdictions.
What's interesting emerges when examining how volatility metrics shift player behavior during May 2026 regulatory updates, because new reporting requirements in several regions now mandate disclosure of volatility ranges alongside standard game information. These disclosures appear in player interfaces and help frame expectations about payout patterns without altering the underlying random number generation. Observers note that such transparency correlates with measurable changes in session continuation rates across monitored platforms.
Data Patterns from Industry Analyses
Studies conducted by university-affiliated gaming laboratories reveal that volatility metrics predict bankroll depletion rates more accurately than return-to-player values alone when sessions extend beyond 500 spins. Medium-volatility games produce the most stable session length distributions in these models, with fewer abrupt terminations compared to extremes on either end of the scale. Operators integrate these insights when curating game libraries, because portfolio balance across volatility tiers supports varied session preferences observed in aggregated user data.
One analysis from the Canadian Partnership for Responsible Gambling examined session records spanning multiple provinces and found that volatility exposure influences the distribution of play intervals, particularly when combined with stake size variations. These records demonstrate consistent statistical relationships rather than individual outcomes, since each spin remains independent under certified random number generators.
Integration with Platform Features
Modern slot platforms incorporate volatility filters that allow players to sort titles according to documented metrics before starting sessions. These tools draw from certified testing data supplied by independent laboratories, ensuring classifications reflect verified performance across extensive spin samples. Session tracking software then records how selections based on volatility preferences affect total play duration and return patterns. Evidence suggests such features appear more frequently following industry standardization efforts completed ahead of May 2026 compliance deadlines in select markets.
Turns out the relationship between volatility metrics and extended sessions also depends on bonus round structures, because features with high volatility multipliers can compress or expand effective session lengths depending on trigger rates. Developers document these interactions through detailed probability tables that accompany each release.
Conclusion
Volatility metrics continue to provide essential frameworks for understanding payout dynamics in digital slot offerings, particularly as they relate to the length and structure of play sessions. Comprehensive data collection from operators, combined with statistical modeling from research entities, establishes clear connections between volatility classifications and observed session behaviors across diverse player populations. These measurements support informed game selection processes while remaining grounded in the independent probability mechanisms that govern each outcome.