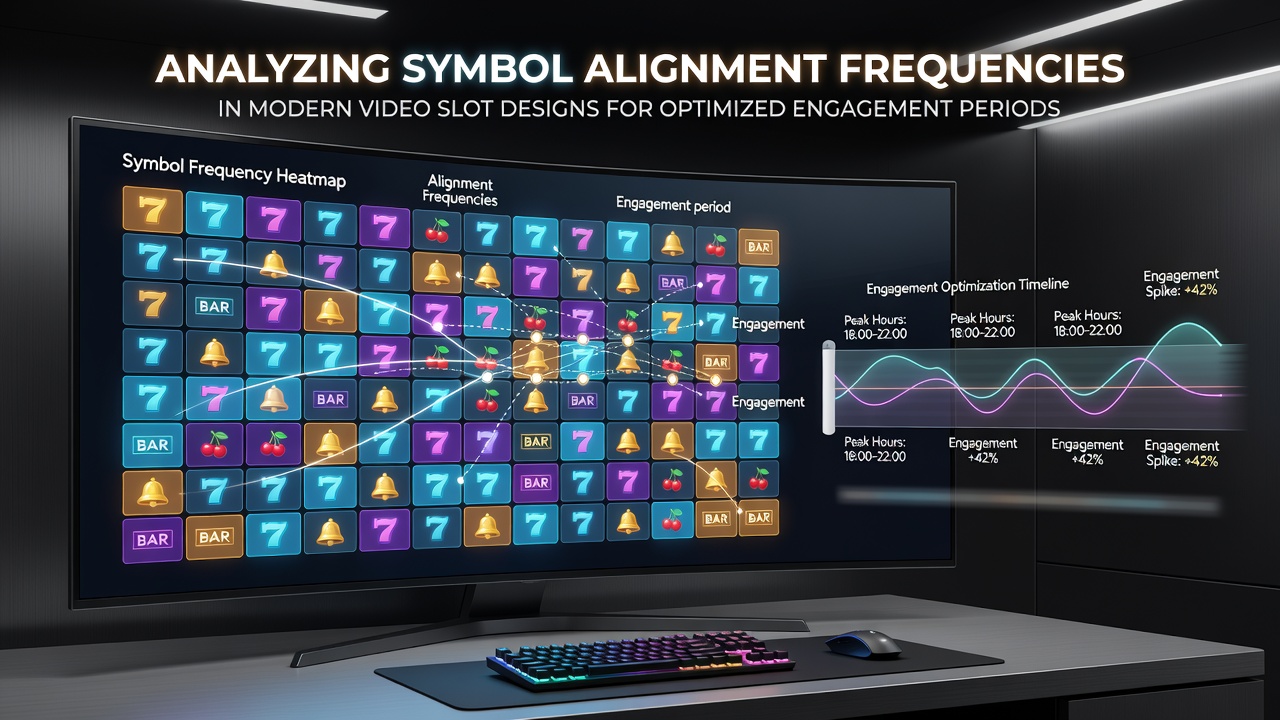
Symbol Alignment Patterns in Contemporary Video Slot Mechanics and Player Session Dynamics
Modern video slot designs rely on precise calculations of symbol alignment frequencies to shape how often winning combinations appear on the reels, and researchers have examined these mechanics to understand their influence on session durations across various platforms. Reel strips contain weighted symbols that determine the probability of specific alignments forming during each spin, while random number generators select stopping positions independently yet produce predictable long-term frequency distributions based on the programmed configuration.
Core Mechanics Behind Symbol Distributions
Designers program reel strips with multiple instances of lower-paying symbols alongside fewer high-value ones, which creates measurable hit rates that vary by payline configuration and bet level. Studies from institutions such as the University of Nevada, Las Vegas have documented how these distributions translate into alignment probabilities, revealing that three-symbol matches on base game reels occur at rates ranging from 1 in 20 to 1 in 80 spins depending on the title's volatility profile. Observers note that scatter symbols and bonus triggers follow separate frequency tables that operate outside standard payline rules, allowing developers to calibrate engagement windows where feature activations cluster during extended play sequences.
Alignment analysis requires mapping every possible stopping position across virtual reels, then calculating the total combinations that produce winning outcomes versus those that result in non-paying results. This process yields exact percentages for each symbol type, enabling precise modeling of how often stacked wilds or multiplier symbols land in positions that complete multiple paylines simultaneously. Data from the Nevada Gaming Control Board shows consistent patterns in licensed machines where these frequencies remain fixed after certification, providing operators with stable metrics for session monitoring.
Tracking Engagement Windows Through Frequency Data
Operators examine alignment frequencies alongside player behavior logs to identify periods when symbol matches occur at rates that sustain longer sessions. Research indicates that titles with moderate hit frequencies between 25 and 35 percent tend to maintain activity levels across 15 to 40 minute intervals before natural drop-off begins, whereas higher-volatility configurations show engagement spikes followed by quicker exits. These observations come from aggregated play data rather than individual outcomes, since each spin remains independent under regulatory standards.

What's interesting emerges when developers adjust reel weighting to create clusters of near-miss alignments that precede bonus rounds, a technique documented in technical reports from the Australian Government’s Department of Social Services. Such patterns encourage continued play during specific time blocks, and analysts have mapped these intervals against average session lengths recorded in multiple jurisdictions. The resulting datasets allow comparison across different markets without relying on any single regulatory framework.
Analytical Methods and Industry Applications
Specialized software parses game logs to count exact symbol landing positions over millions of simulated spins, producing frequency tables that match theoretical calculations derived from reel strip compositions. Engineers then cross-reference these outputs with time-stamped engagement metrics to locate optimal periods when alignment rates align with peak player retention. One case involved a developer who adjusted symbol weights on a five-reel title and recorded a measurable shift in the timing of bonus triggers, extending average play sessions by measurable margins according to internal testing protocols.
Further examination covers how multi-level progressives and cascading reel mechanics alter alignment frequencies mid-session, since symbol removal and replacement change the composition of subsequent reels. Reports from the Gaming Policy and Enforcement Branch in British Columbia have highlighted that these dynamic elements require updated probability models to maintain compliance while preserving the intended engagement flow. Analysts therefore run iterative simulations that account for state changes rather than treating each spin as an isolated event.
Future Considerations in Design Calibration
As slot technology incorporates more interactive elements, frequency analysis must expand to include symbol alignments that trigger during player-selected modifiers or bonus buy features. Industry organizations such as the European Gaming and Betting Association have noted that transparent reporting of these probabilities supports regulatory oversight across different regions. Updated modeling techniques now incorporate machine learning to predict how alignment rates interact with session timing under varying bet denominations and autoplay settings.
Continued refinement of these analytical approaches provides operators with clearer pictures of how symbol distributions shape play patterns without altering the fundamental randomness of individual outcomes.
Conclusion
Symbol alignment frequency analysis offers a structured framework for examining how modern video slot designs influence engagement periods through fixed mathematical relationships. By combining reel strip data with session metrics, researchers and operators obtain objective insights that inform both compliance and product development across global markets.