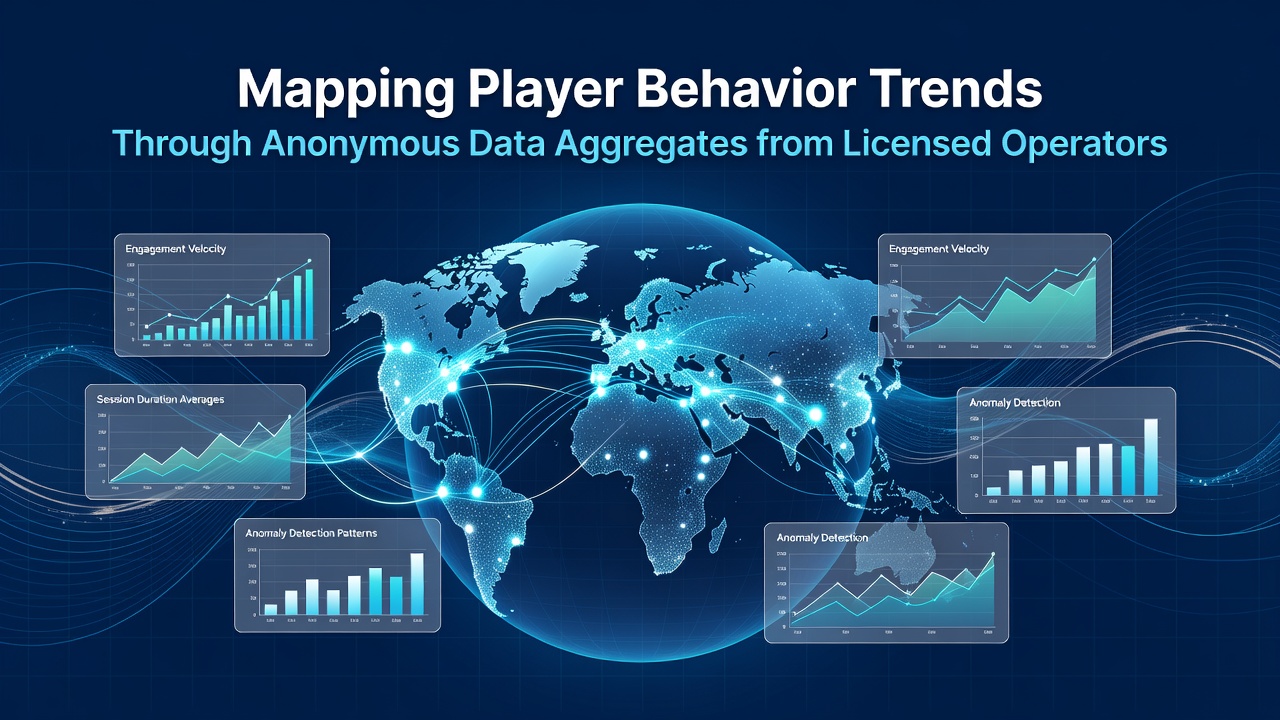
Mapping Player Behavior Trends Through Anonymous Data Aggregates from Licensed Operators
Operators in regulated markets collect vast amounts of transaction and engagement records, then strip away personal identifiers before combining them into group-level datasets that reveal broader activity patterns. These aggregates allow analysts to track metrics such as average session duration, game category popularity, and deposit frequency across thousands of accounts without ever linking numbers back to individuals. Regulatory frameworks in multiple jurisdictions require licensed companies to maintain these datasets for compliance reporting, and the resulting summaries feed into industry-wide studies that governments and academic groups examine. Data handling protocols emphasize encryption and access controls so that even internal staff cannot trace records to specific players. Once de-identified, the information moves into centralized repositories where statisticians calculate medians, quartiles, and correlation coefficients for different player segments. Researchers at institutions like the University of Nevada's International Gaming Institute have published papers that draw on such aggregates to document seasonal fluctuations in table-game versus slot activity. One analysis covering several North American markets found that evening hours consistently showed higher volumes of low-stake wagers, while morning periods featured steadier but smaller transaction sizes.Data Sources and Collection Methods
Licensed operators record every bet, win, and balance adjustment in real time, yet privacy rules mandate that names, addresses, and account numbers are removed before any external sharing occurs. The remaining fields include timestamps, game identifiers, wager amounts, and device types, which combine to form heat maps of activity. Gaming associations in Canada and Australia publish periodic summaries drawn from these sources, allowing comparisons across provinces and states without breaching individual confidentiality.
July 2026 saw several North American regulators release updated aggregate dashboards that incorporated six additional months of post-pandemic data. Those releases highlighted a measurable uptick in multi-game sessions, where players moved between slots and live dealer tables within single logins. The pattern appeared across multiple operators, suggesting it reflected wider behavioral shifts rather than isolated site changes.
Observed Behavioral Patterns
Aggregate figures reveal that participation rates often rise during major sporting events, even among users who primarily engage with casino products. Cross-category analysis shows that sports bettors who also play slots tend to place smaller casino wagers on event days, spreading their activity rather than concentrating it. Similar datasets from European operators indicate that bonus redemption rates peak on weekends, while mid-week periods display steadier, lower-volume play.

Time-of-day distributions demonstrate clear regional differences. Operators serving Asian markets report higher afternoon activity aligned with local commuting patterns, whereas North American datasets show pronounced spikes after 8 p.m. local time. These variations help operators adjust server capacity and responsible gaming prompts without needing to know who is playing at any given moment.
Applications in Research and Regulation
Public health researchers use the same anonymized collections to examine correlations between session length and self-exclusion requests. A longitudinal study drawing on Australian operator data found that accounts displaying extended consecutive play periods were more likely to appear in later exclusion lists, though causation remains unproven. Regulators in several jurisdictions now require operators to submit quarterly aggregate reports that track these indicators at the population level.
Industry groups such as the National Council on Problem Gambling incorporate these summaries into annual white papers that compare trends across different regulatory environments. The reports avoid naming specific companies, focusing instead on percentage changes in average wager size or game-type distribution.
Future Developments
Advances in federated learning techniques allow multiple operators to contribute to joint models while keeping raw records inside their own systems. Early pilots conducted in 2025 demonstrated that such methods can produce more granular trend forecasts than single-operator datasets alone. By July 2026, several European trade associations had begun exploring standardized templates for sharing these model outputs with academic partners.
Continued refinement of aggregation techniques supports both commercial planning and regulatory oversight. The same datasets that inform marketing calendars also feed into evaluations of harm-minimization tools, creating a feedback loop that operates entirely on de-identified numbers.
Conclusion
Aggregated anonymous data from licensed operators supplies a factual foundation for understanding collective player activity across markets. Because personal details stay removed at every stage, the resulting insights serve research, compliance, and operational needs simultaneously. As collection methods and analytical tools evolve, these group-level views will continue to supply measurable indicators without compromising individual privacy.